NDVI Monitoring with Drone – Why It Is Key for Modern Agriculture
Visual assessment of the field "by eye" is no longer sufficient. Plant stress appears at the surface only when the losses are irreversible. NDVI monitoring with a drone allows you to see the invisible – weeks before symptoms become noticeable to the naked eye. Multispectral maps show precisely where the crop is suffering, why and how urgent intervention is.
AirAgro offers NDVI mapping and precision spraying in the areas of Plovdiv, Stara Zagora, Pazardzhik, Haskovo, Dobrudzha and the entire Thracian Plain – a combination that turns data into concrete actions in the field.
What Is NDVI and How Is It Calculated
NDVI (Normalized Difference Vegetation Index) is a normalised vegetation index introduced by Rouse et al. (1974). It measures the photosynthetic activity of plants through the ratio between reflected near-infrared (NIR) and red (RED) light.
NDVI Formula
$$NDVI = \frac{NIR - RED}{NIR + RED}$$
Healthy plants absorb red light for photosynthesis and strongly reflect near-infrared. Stressed or dead plants do the opposite.
NDVI Scale of Values
| NDVI value | What it means | Visual colour on map | | ----------- | ----------------------------------------- | -------------------- | | –1.0 to 0.0 | Water, bare soil, rocks | Dark blue / brown | | 0.0 to 0.2 | Bare or very poor soil | Brown / beige | | 0.2 to 0.4 | Sparse vegetation, early stress | Yellow / orange | | 0.4 to 0.6 | Moderate vegetation, possible mild stress | Light green | | 0.6 to 0.8 | Healthy, actively photosynthesising crop | Green | | 0.8 to 1.0 | Maximum vegetative activity | Dark green |
Values below 0.4 during a period of active growth are a signal of a problem requiring immediate field inspection.
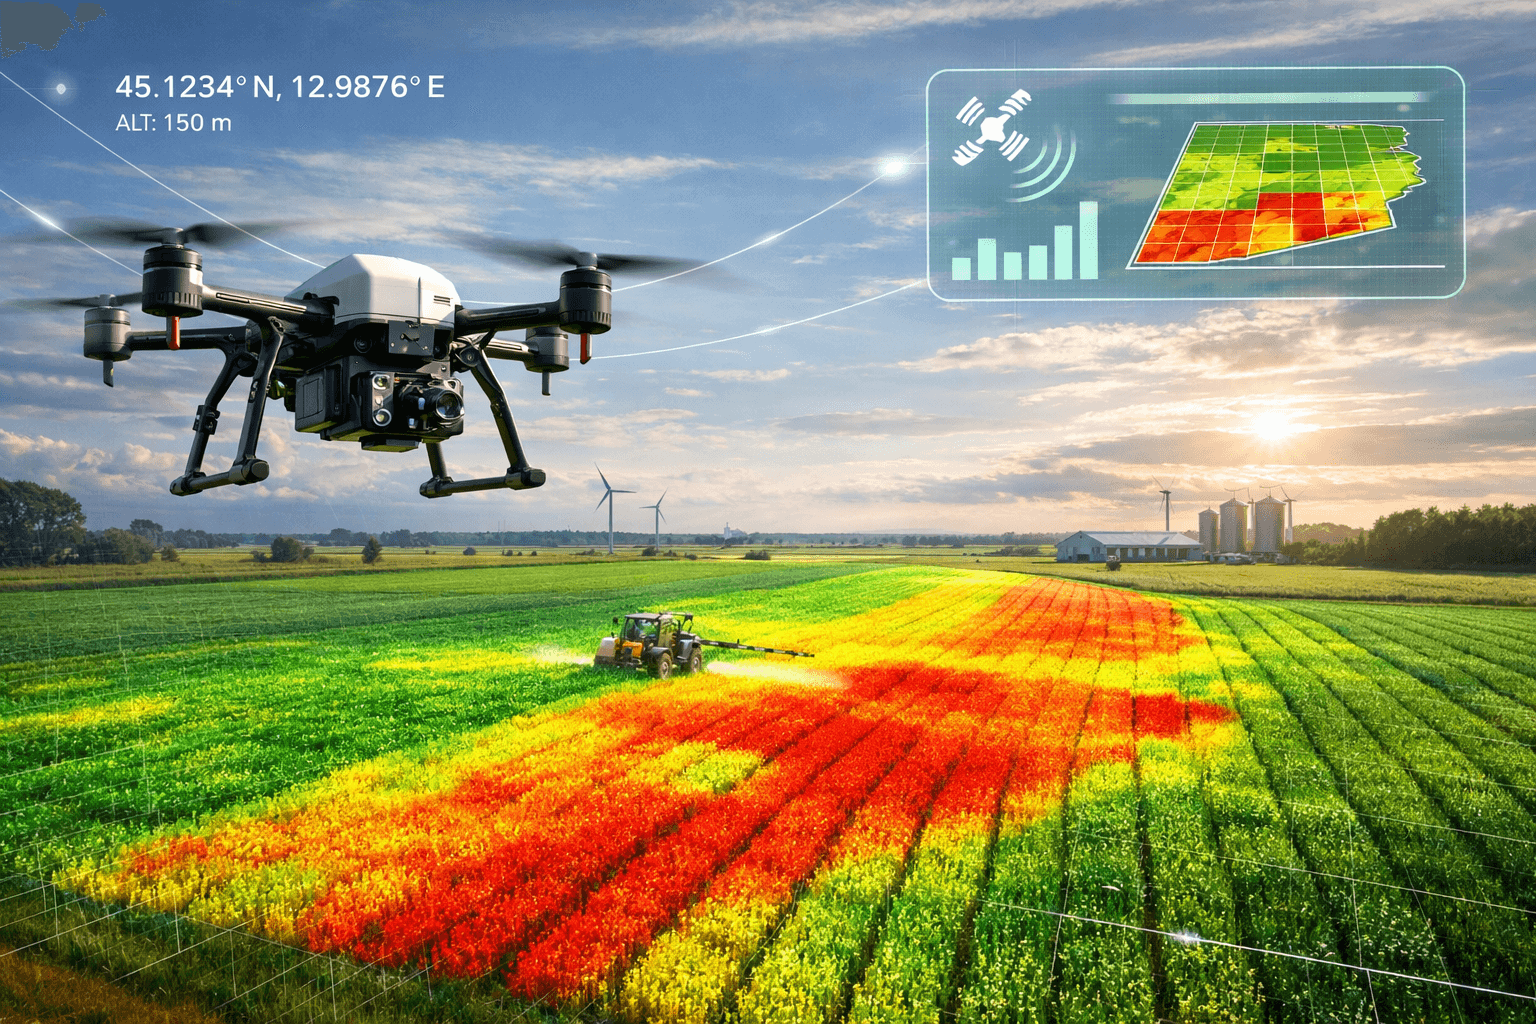
How NDVI Mapping with a Drone Works
Multispectral Cameras
Unlike a standard RGB camera, a multispectral sensor captures in 4–6 spectral bands: red (RED), green (GREEN), near-infrared (NIR), red edge (Red Edge) and sometimes SWIR. The DJI Mavic 3 Multispectral, for example, has 4 multispectral sensors + RGB camera specially designed for agricultural analysis. Data from each spectral channel are combined to calculate not only NDVI but also additional indices such as NDRE (Normalized Difference Red Edge), which is more sensitive to nitrogen status in crops with dense canopy cover.
Flight Planning and Image Capture
- Defining the flight zone – plot contours are set in autonomous flight software
- Parameter settings – altitude 30–60 m, overlap 75–80 %, capture speed
- Autonomous flight – the drone follows the set route and captures hundreds of georeferenced images
- Calibration – before and after flight a calibration panel is photographed for accurate radiometric values
At a standard flight altitude of 40 m, one drone covers 200–400 dka/hour with a resolution of 2–3 cm/pixel.
Data Processing
The raw multispectral images are processed with specialised software that generates an orthomosaic and NDVI map. The entire process – from flight to ready map – takes between 2 and 24 hours depending on the area.
What NDVI Monitoring Reveals
NDVI monitoring with a drone detects problems that remain invisible during a normal visual inspection:
Diseases
Fungal infections (rusts, powdery mildew, septoria) reduce NDVI values in affected zones 7–14 days before visual symptoms. On the map clearly outlined patches with NDVI 0.25–0.40 are visible amid healthy crop with 0.65+.
Water Stress and Drought
Zones with insufficient moisture show gradually decreasing NDVI from the periphery inward. Typically – strips along field edges or around elevations where water drains away.
Nutrient Deficiency
Nitrogen deficiency manifests as uniformly reduced NDVI (0.35–0.50) in entire sections. Combining NDVI with foliar fertilization enables precise fertilizer application only where needed.
Pests
Infestation by grain bugs, aphids or European corn borer creates characteristic irregular patches with reduced NDVI, different from the symmetrical patterns of water or nutrient stress.
Uneven Germination
Even in early phases (BBCH 12–14) the NDVI map shows zones with poor germination – causes may be uneven sowing depth, soil compaction or poor drainage.
NDVI Monitoring by Crop
Wheat
- Tillering (BBCH 21–29): NDVI 0.3–0.5 – assessment of density and nutritional status
- Stem elongation (BBCH 30–39): NDVI 0.5–0.7 – critical moment for fungicide spraying
- Grain filling (BBCH 70+): NDVI > 0.6 indicates preserved leaf mass
Sunflower
Monitoring at 4–6 leaves and budding reveals uneven development and Orobanche (broomrape) attacks. Zones with NDVI < 0.35 at budding signal a serious infestation.
Corn
Corn is sensitive to nitrogen deficiency at the 6–8 leaf stage. The NDVI map guides precision foliar fertilization, saving 20–30% of fertilisers.
Vineyards
Multispectral analysis of vineyards detects water stress, downy mildew and powdery mildew by rows. High resolution (2 cm/px) allows analysis of each individual row – key for quality viticulture.
Orchards
With apples, peaches and cherries, NDVI distinguishes individual trees with reduced activity. This is invaluable for early diagnosis of root rots, iron deficiency or frost damage.
Advantages of Drone NDVI over Satellite Monitoring
Although satellite platforms (Sentinel-2, Planet) offer free or cheap access to NDVI data, drones provide substantial advantages for farms up to 10,000 dka:
- Resolution: 2–5 cm/px with drone vs 3–10 m with satellite – a difference of 100–500 times
- Independence from cloud cover: satellites are useless with clouds, and Bulgaria has an average of 120+ cloudy days per year
- Flexibility: the flight is performed on the day the agronomist needs data, not when the satellite passes
- Additional indices: the drone captures the Red Edge channel, which most free satellites do not offer
The optimal strategy is combined: satellite screening for general overview + drone NDVI for detailed analysis of problem zones.
Integration: From NDVI Map to Precision Spraying
The true value of NDVI monitoring is realised when data lead to concrete actions. AirAgro applies a comprehensive approach:
- NDVI survey – the drone maps the field and generates an index map
- Analysis and recommendation – we identify problem zones and determine the type of stress
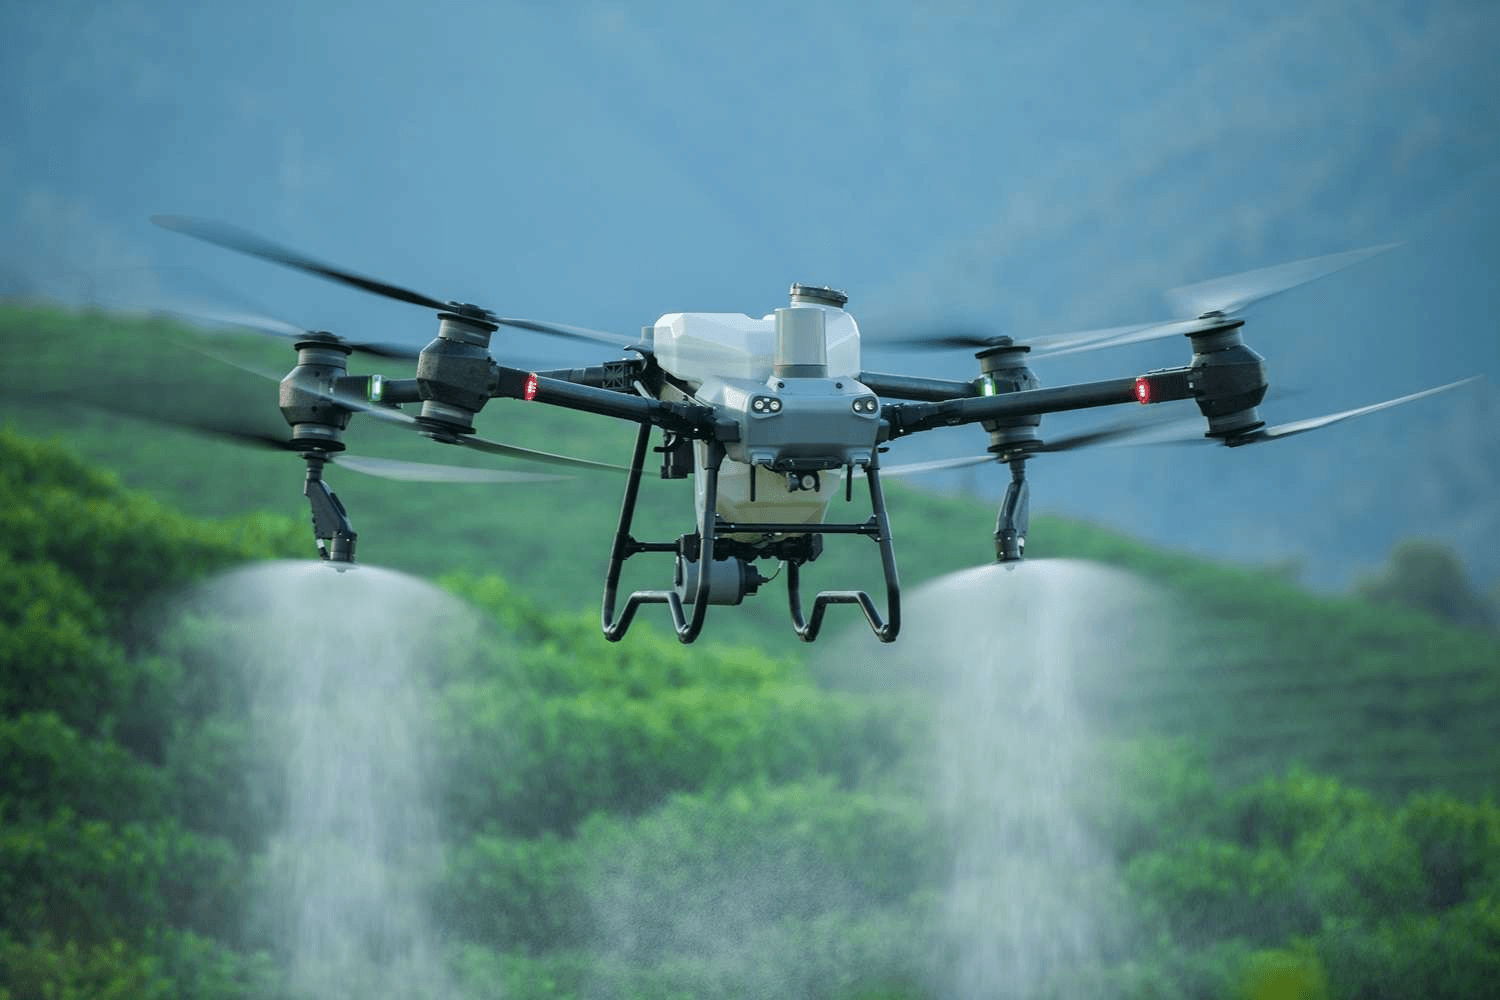
- Targeted spraying – the DJI Agras T50 treats only affected areas with appropriate preparation. This is the essence of precision agriculture
- Control survey – 10–14 days after treatment, a repeated NDVI flight checks the effect
Result: 30–50% less preparation, fast response and documented improvement.
NDVI Analysis Software
| Software | Advantages | Suitable for | | --------------- | ------------------------------------------------------------ | -------------------------- | | Pix4Dfields | Fast processing, offline operation, high-accuracy index maps | Large farms, agronomists | | DroneDeploy | Cloud platform, easy interface, team sharing | Medium farms, cooperatives | | DJI Terra | Direct DJI drone integration, automatic calibration | DJI equipment operators |
All three platforms generate NDVI, GNDVI, NDRE and other vegetation indices. Pix4Dfields is preferred for offline processing of large areas, while DroneDeploy facilitates result sharing between agronomist, owner and operator.
NDVI Monitoring Calendar Through the Season
| Period | Crop | Monitoring objective | | ------------- | ----------------------------- | ------------------------------------------ | | March – April | Winter wheat, rapeseed | Post-winter assessment, nutritional status | | April – May | Wheat (stem elongation) | Diseases, fungicide need | | May – June | Corn, sunflower (early stage) | Germination, weeds, nitrogen deficiency | | June – July | All crops | Water stress, pests, second fertilization | | July – August | Sunflower, corn, vineyards | Maturity, yield forecast | | Sept. – Oct. | Autumn crops (after sowing) | Germination, uniformity |
We recommend a minimum of 3 NDVI surveys per season for full monitoring of each crop.
Frequently Asked Questions
What is the difference between a drone NDVI image and a satellite image?
A drone provides a resolution of 2–5 cm/pixel vs 10–30 m with a satellite (Sentinel-2, Landsat). For areas up to 5,000 dka the drone is significantly more accurate and does not depend on cloud cover. Satellite data are useful for initial screening of very large areas.
How often should NDVI monitoring be done?
Optimally every 2–3 weeks during the active vegetation period. In critical phases (stem elongation in wheat, budding in sunflower) – once a week. The minimum is 3 times per season.
Can NDVI replace the agronomist?
No. The NDVI map is a diagnostic tool that shows where the problem is, but not always exactly what it is. The agronomist interprets the data, takes soil and leaf samples and determines the specific cause. NDVI significantly speeds up and focuses their work.
What conditions are needed for quality NDVI mapping?
The flight is performed in clear weather, with the sun above 30° above the horizon (usually 10:00–15:00). Wind up to 5 m/s. A calibration panel is mandatory for accurate results. Mapping is not recommended during dew or immediately after rain.
How much does NDVI monitoring with a drone cost?
The price depends on area and frequency. Contact AirAgro for an individual offer – we offer seasonal subscription plans that include monitoring + targeted spraying at preferential prices.
Order NDVI Monitoring from AirAgro
Do not wait for problems to become visible. With NDVI monitoring with a drone from AirAgro you will have an accurate map of crop health and a clear action plan.
We serve agricultural farms in the areas of Plovdiv, Stara Zagora, Pazardzhik, Haskovo, Dobrudzha and the Thracian Plain.
Call us now: +359 884 242 406
Learn more about our agri-drone services or read how precision agriculture works.